
Part 3: Can you Achieve Optimal Blood Glucose Control as a Type-1 Diabetic?
This article was developed and published in September 2018. Some of the views and evidence presented in this article may have evolved since their original development due to advancing literature and knowledge. Please look out for more recent articles, publications, etc... for the most up to date information revolving these topics.
Throughout my youth, I struggled with weight gain and eventually became clinically obese. After much personal struggle, I took responsibility for my health and began learning about nutrition and exercise. With hard work and determination, I went from 252lbs to 175lbs and developed a lifelong affinity for fitness and nutrition. This knowledge and determination became a powerful asset to my life when I was diagnosed with Type-1 Diabetes one year later. Being a Type-1 Diabetic requires constant management of nutrition and medication (insulin) to control the short and long-term complications of this disease (Section 2). Disease management often requires hourly adjustments with medication and food to prevent extreme highs and lows of blood glucose. As stated in previous sections, chronically elevated blood glucose, which is extremely common in Type-1 Diabetics, can lead to serious long-term health complications and reduced healthspan (Section 2). However, do we as Type-1 Diabetics have to accept this? I believe the answer to that question is a resounding “NO”. Understanding the factors that introduce variability into glycemic control can allow a Type-1 Diabetic to better control and predict them, allowing a Type-1 Diabetic to mitigate the potential negative impacts on glycemic management.
The good news is that there are ways to mitigate those outcomes. The more well versed you are on nutrition, exercise, lifestyle and how these impact exogenous insulin sensitivity, the better prepared you are as a Type-1 Diabetic to manage your disease and health outcomes right now and for the remainder of your life. Unfortunately, many Type-1 Diabetics are only given “enough” information to manage their disease to avoid acute health complications. I argue that “enough” is not adequate to optimize glycemic control.
This section will focus on nutrition’s critical role in Type-1 Diabetes management. I will discuss two distinct dietary options, the commonly prescribed Standard Dietary Guidelines vs. the Very-Low Carbohydrate Diet, including:
Why the Standard High Carbohydrate Diet is Prescribed for Type-1 Diabetics
How Dietary Macronutrient Compositions Influence Non-Diabetic and Type-1 Diabetic Blood Glucose Metabolism
Endogenous vs Exogenous Insulin Influence on Dietary Choices
Very-Low Carbohydrate Diet’s Influence on Glucose Metabolism and Insulin Requirements
Personal Anecdotes Utilizing Both Dietary Options
Research on Very-Low Carbohydrate Diets in Type-1 Diabetics
Resources
High Carbohydrate Approach-Standard Dietary Guidelines:
While the most up to date recommendations for Type-1 Diabetics call for individualized nutrition plans (Franz, Boucher, & Evert, 2014), upon diagnosis, most Type-1 Diabetics are still given the following dietary prescription: A high carbohydrate, moderate protein, low fat diet (Franz et al., 2014; Franz et al., 2010; Oza-Frank, Cheng, Narayan, & Gregg, 2009). This diet resembles the Standard Dietary Guidelines (American Diabetes, 2018b; Health, 2011; USDA, 2018a):
3 Meals/day:
60-75g carbohydrates/meal
Low glycemic carbohydrate sources
Protein at each meal (to help maintain elevated BG levels)
Less dense fat sources are recommended
2 snacks/day (as needed)
Small-medium fruit
Small apple, half banana, orange, etc.
While this is the most common dietary advice given to Type-1 Diabetics upon diagnosis, there has been no clinical trial to validate that this nutritional plan is optimal for Type-1 Diabetic glycemic management. Question: Then why are these recommendations given to Type-1 Diabetics?
Three main reasons

Figure 1. Carbohydrate Recommendations for Type-1 Diabetic Females and Male. (Constance A, 2011)
1. Standard Recommendations: A high carbohydrate, low fat nutritional plan is the “standard” recommendation often given for the non-diabetic population (American Diabetes, 2018b; Health, 2011; USDA, 2018a). This nutritional plan is generally viewed as “healthy” for the average person by many in the medical community [not a ubiquitous opinion (Feinman et al., 2015)]. Consequently, it has also been recommended to Type-1 Diabetics. Without multiple trials validating a specific nutritional plan for Type-1 Diabetics, many doctors would be unwilling to try anything outside of what would be perceived as “standard.” Furthermore, some doctors may be ill-equipped to guide patients on a non-traditional dietary regimen.
![Figure 2 Food Plate Examples/Food Recommendations taken from Harvard School of Public Health [left (Health, 2011)], United States Department of Agriculture [middle (USDA, 2018a)] and American Diabetes Association [right (American Diabetes, 2018b)]. …](https://images.squarespace-cdn.com/content/v1/5b7c64af620b85f7900691ed/1536678459974-NFNJUKWNH2I1LL5S9P20/blog3+2)
Figure 2 Food Plate Examples/Food Recommendations taken from Harvard School of Public Health [left (Health, 2011)], United States Department of Agriculture [middle (USDA, 2018a)] and American Diabetes Association [right (American Diabetes, 2018b)]. These plate recommendations are very similar across organizations.
2. Social Stigma: Doctors often do not want to add an additional social burden onto a child or family. Many doctors know that a new disease may cause a child to feel “different” from their peers. Consequently, many doctors do not want to ask that child or family to take up a new and/or different eating strategy from their peers. There may be concern that it could further separate that child from “normalcy.” Instead, doctors tend to focus on teaching a child and/or family with Type-1 Diabetes to take insulin for the foods they consume, instead of choosing food options based on the kinetics of exogenous insulin. (see below section)
3. Compliance: Some endocrinologists and/or dieticians do not feel that patients will implement new, different, and/or restrictive dietary strategies. As such, doctors often ask the patient to implement what they think they will comply with.
Macronutrients:
By definition, a “macronutrient” is “a chemical element or substance that is ‘essential’ in relatively large amounts to growth and health of a living organism” (Merriam-Webster, 2018). Carbohydrates, fats, and protein are traditionally thought of as the macronutrients. However, based on the definition, the only macronutrient components that are “essential” for survival are “essential amino acids” from protein and “essential fatty acids” from fats. These specific amino acids and fatty acids cannot be endogenously generated within the body. Thus, the definition does not apply to all nutrient sources. However, the medical community at large considers all these large calorie sources macronutrients, thus, we will follow this precedence. As you can see from the above recommendations (Harvard, USDA, ADA), the bulk of food and calories are coming from carbohydrates in the form of grains, starches, and fruits (American Diabetes, 2018b; Health, 2011; USDA, 2018a). A list of these carbohydrate sources can be found on Harvard’s (Health, 2018a, 2018b), United States Department of Agriculture’s (USDA, 2017, 2018b), and the American Diabetes Association’s websites (American Diabetes, 2017, 2018c). Based on these guidelines, protein and fat are consumed in smaller percentages of total caloric intake.
Metabolism of Micronutrients:
Carbohydrates: Carbohydrates (minus fiber) are enzymatically and mechanically (mixing and churning via gastrointestinal motility) broken down into smaller polysaccharides and monosaccharides components. These saccharides are transported to the liver where they are converted into individual glucose molecules. These glucose molecules are then transported into systemic circulation (Section 1). Consequently, almost all starchy, sugary carbohydrate sources directly and rapidly raise blood glucose levels in a dose-dependent manner (more carbohydrates = more blood glucose).
Protein: Protein is broken down into peptides (amino acid chains) in the gut. Once they enter the intestinal cells, they are further broken down into individual amino acids. These amino acids facilitate the elevation of the hormone glucagon (Paterson et al., 2015). Glucagon facilitates the breakdown of glycogen stores from the liver, raising blood glucose. Some amino acids are gluconeogenic and some ketogenic. Thus, a portion of amino acids can be used to create glucose and ketones (if needed). A portion of these amino acids can undergo gluconeogenesis at the liver and increase glucose levels in the blood. However, the elevation in blood glucose post-protein ingestion is reported to start ~0.5-2hours post-meal and can last beyond 5 hours (Pal & Ellis, 2010; Paterson et al., 2015). Thus, the increase in glucose post-protein ingestion (compared to carbohydrates) is indirect, smaller, delayed and prolonged (Collier & O'Dea, 1983; Paterson et al., 2015).
Fat: Fats/lipids when ingested are typically in the form of triglycerides. Triglycerides are composted of a glycerol backbone and three fatty acid chains. While fatty acids cannot be converted into glucose, glycerol can be converted to glucose (Berg JM, 2002). However, this conversion is inconsequential on blood glucose levels. Therefore, digesting fat will cause no noticeable post-absorption elevation in blood glucose.
In 1983, Collier and O’Dea examined the insulin response to ingestion of 50g carbohydrate (boiled potato) and 50g protein (veal), with or without 50g of fat (butter) [Figure 3; (Collier & O'Dea, 1983)]. While Collier and O’Dea did not look at the blood glucose elevation of these foods, they did look at the insulin response for each macronutrient source. This information helps us understand the blood glucose elevating effect of each macronutrient source. In Figure 3, carbohydrates in isolation caused a rapid elevation in endogenous insulin which peaked at 30 minutes and returned to baseline between 180-240 minutes post-ingestion. Protein in isolation caused a moderate elevation in insulin that peaked at 60 minutes and stayed slightly above baseline 240 minutes post-ingestion. Co-ingestion of fat with either carbohydrates or protein appeared to alter the kinetics of the insulin response by altering the peak point and prolonging the insulin exposure.
Figure 3 also demonstrates that co-ingestion of fat did not significantly alter the quantity of insulin released for ingestion of either carbohydrates or protein, indicating that fat itself did not induce insulin release or significantly alter the quantity of insulin to other macronutrients.
Together, these data indicate that carbohydrates and/or protein are the only macronutrients that caused a measurable blood glucose-induced insulin response. Carbohydrates caused a higher and more rapid elevation in insulin compared to protein. Protein ingestion resulted in a 60% lower insulin response compared to carbohydrates, indicating that the glucose elevation from protein is lower and more delayed. These data also indicate that fat had no measurable influence over insulin secretion and did not contribute to an elevation in glucose post-meal ingestion. With this information in mind, as a Type-1 Diabetic, insulin is required to attenuate blood glucose elevations for both carbohydrates and protein.
These data reveal the insulin response during and after a single meal. What about an entire day? Thompson et al. illustrated the predicted normal physiological insulin response that would occur over a 24-hour period with 3 mixed meals [Figure 4; (Thompson R, 2006)]. Mixed meals are those which consist of carbohydrates, protein, and fat. Figure 4 illustrates that there is typically a need for insulin 24/7, but the quantity required depends on the time of day and nutrients within each meal. If a Type-1 Diabetic were to consume 3 mixed meals, they would be required to match this insulin response seen in non-diabetic populations to control for the glucose elevations from both carbohydrates and protein, and Type-1 Diabetics must also match the residual insulin requirements outside of meals.

Figure 4 Predicted Endogenous Insulin Response to Mixed Meals Over a 24-hours Period. Figure 1 from (Thompson R, 2006).
Pharmacokinetics of Insulin:
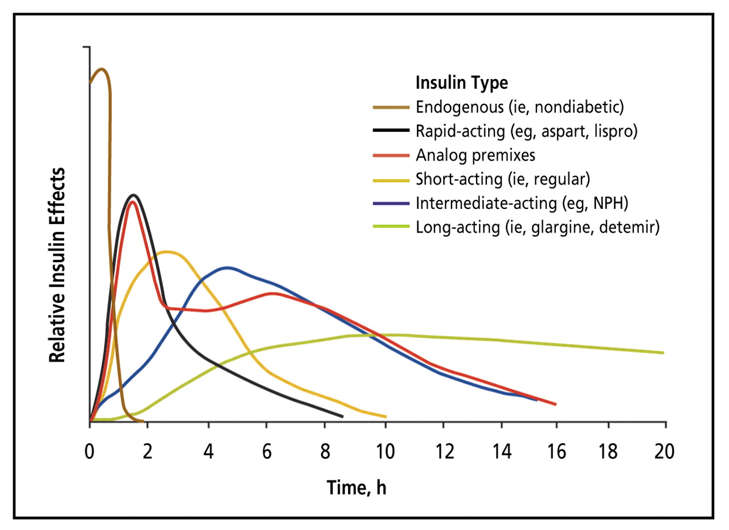
Figure 5 Estimated Pharmacokinetics of Endogenous and Exogenous Insulin. Insulin’s onset, peak, and duration varies tremendously depending on the type of insulin. There is also different pharmacokinetics across individuals. While not illustrated in this figure, other factors influence insulin’s kinetics (absorptions & sensitivity; Section 1). Figure 2 from (Freeman, 2009).
To shuttle blood glucose into various tissues, you almost always need insulin (Section 1; few tangible exceptions). Since carbohydrates and protein elevate blood glucose levels, and the body produces residual glucose during the fasting periods (Section 1), Type-1 Diabetics will need to take exogenous insulin for all three of these scenarios. However, as you can see in Figure 3, not all macronutrients require the same quantity or rate (kinetics) of insulin. Thus, for example, a Type-1 Diabetic would not want to take a long-acting insulin for a carbohydrate meal as it would result in hyperglycemia. It would take that kind of insulin all day to lower the carbohydrate-induced blood glucose elevation back into the normal range. Similarly, you would not want to take rapid-acting insulin to cover residual blood glucose production during the fasting period as you would quickly go into hypoglycemia. Therefore, it is critical to understand the glucose kinetics of BOTH macronutrient intake AND exogenous insulin to stabilize blood glucose with an appropriately matched insulin bolus. See Figure 5 for predicted insulin pharmacokinetics (Freeman, 2009). Keep in mind, there are both intraindividual (Section 1) and interindividual variables for insulin requirements. In fact, insulin kinetics are often reported slightly differently from one publication to another (Bernstein, 2011; Chamberlain et al., 2017; Freeman, 2009; Mooradian, Bernbaum, & Albert, 2006). To account for this, Table 1 provides a wide range of onset, peak, and duration times which encompass potential kinetics across exogenous insulin sources. However, this is still generalized and may not represent all individual’s insulin kinetics.
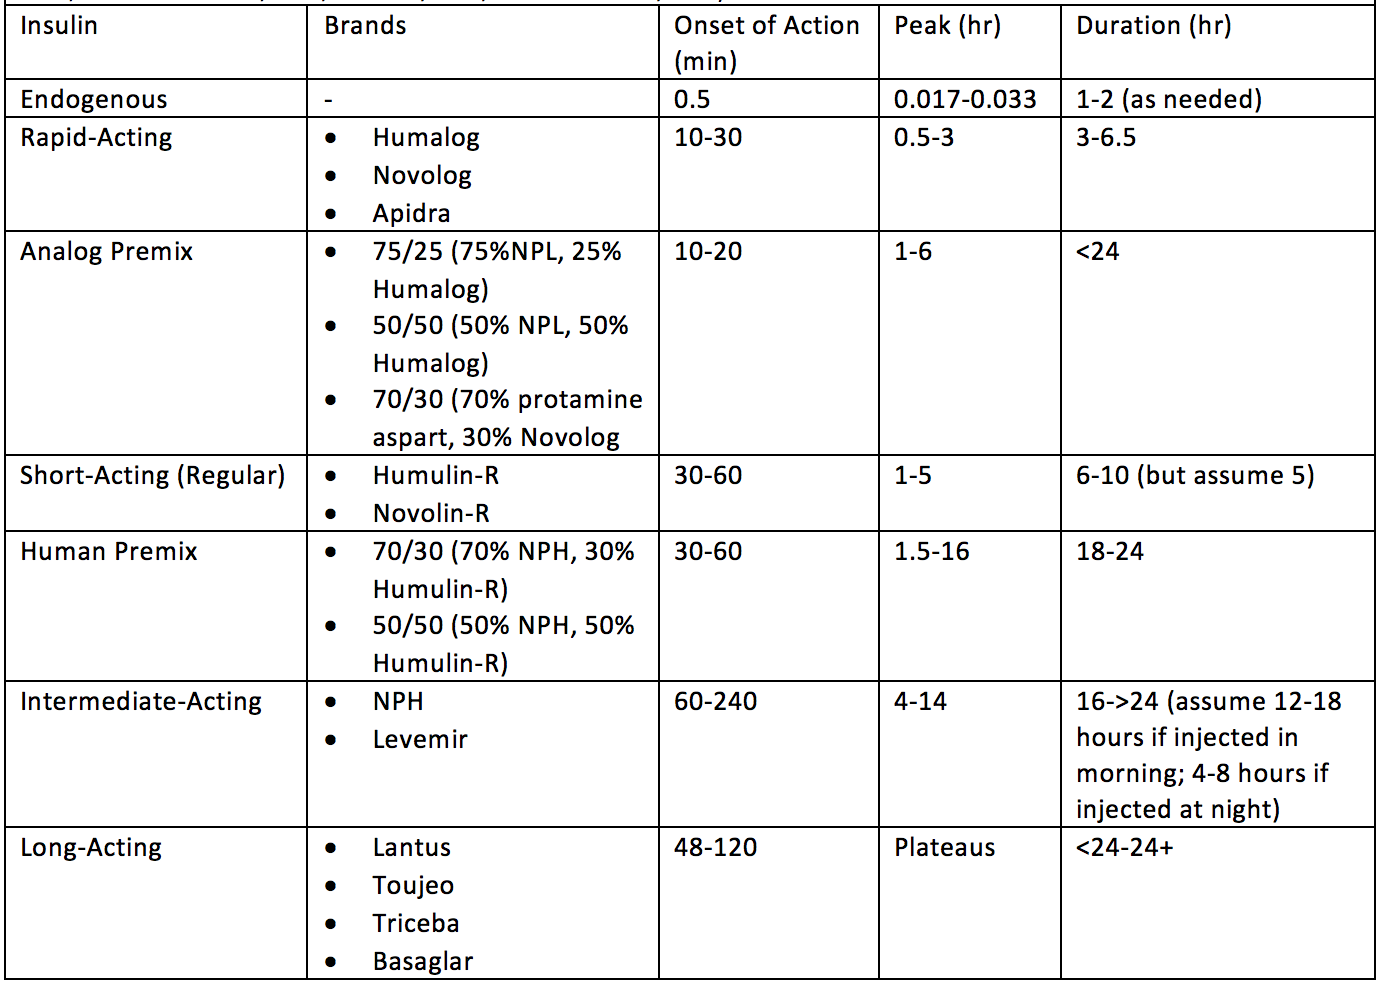
Table 1 Estimated Insulin Onset, Peak, and Duration Between Various Forms of Exogenous Insulin from Various Sources. (Bernstein, 2011; Chamberlain et al., 2017; Freeman, 2009; Mooradian et al., 2006).
Combining Macronutrients and Insulin: Finding the Match

Figure 6 Predicted Endogenous Insulin Response to Mixed Meals Over a 24-hour Period with Basal and Bolus Insulin Requirements Indicated. Figure 1 from (Thompson R, 2006).
Based on the predicted insulin secretion models (Figure 4) and normal physiological insulin response to a mixed meal (Figure 3), a Basal-Bolus Protocol is the most logical approach to try to match nutrition and insulin requirements. Consequently, it is not a surprise that the Basal-Bolus Protocol is the most commonly used insulin regimen for Type-1 Diabetics (American Diabetes, 2018a). The Basal-Bolus Protocol typically uses two types of insulin. Basal insulin is a long-acting insulin that provides a steady low level of insulin for matching insulin released during fasting periods (Figure 6). Bolus insulin uses more rapid-acting exogenous insulins to cover food ingestion (or elevated blood glucose levels in between meals). The amount of bolus insulin required is typically based on the carbohydrate counting method (Section 2). Keep in mind the combination of the Basal-Bolus Protocol + Carbohydrate Counting does not equate for protein. In theory, using a basal insulin for 24/7 residual glucose flux and bolus insulin for carbohydrates should match the normal physiological insulin response (Figure 7), however you will see this is not the case.
Does the Basal-Bolus Protocol on Standard Dietary Approach Normalize Glycemic Control?
Alemzadeh et al. 2005 examined the glycemic control of patients who utilized a Basal-Bolus Protocol for two years [Table 2; (Alemzadeh et al., 2005)]. These researchers examined if they could improve the glycemic control of this protocol by changing the patient’s choice of basal insulin to one long-acting insulin shot (instead of two separate intermediate acting insulin shots). In the first year, the patients had an HbA1c 8.7-9.0%, and the second year they had HbA1c of 8.3-8.4%, indicating a clear failure to normalize blood glucose utilizing the Basal-Bolus Protocol, regardless of the type of basal insulin used.

Table 2 Basal-Bolus Protocol using intermediate-acting insulin 2x/day + rapid acting insulin (Before) or long-acting 1x/day + rapid acting insulin (After) (Alemzadeh, Berhe, & Wyatt, 2005).

Figure 8 Basal Bolus Protocol Using Basal Insulin + Regular Insulin (▪) or Basal Insulin + Rapid-acting insulin (▴). Figure 9A reflect average blood glucose values throughout the day. Figure 9B illustrates the HbA1c in both groups. Figure 1 from (Cherubini et al., 2006).
Cherubini et al. 2006 evaluated the glycemic control of two groups of children, both using the Basal-Bolus Protocol (Cherubini et al., 2006). The only difference between the groups was that one group used regular-acting bolus insulin while the other group used rapid-acting bolus insulin. The average blood glucose (Figure 8A) and HbA1c (Figure 8B) across all children implementing either type bolus insulin on the Basal-Bolus Protocol resulted in average blood glucose 135-180mg/dL and HbA1c 7-7.5%, well above normal glycemic levels of 80-120mg/dL and less than 5.7% respectively.
Heller et al. 2012 looked at over 600 patients using a Basal-Bolus Protocol with two separate types of basal insulins (Heller et al., 2012). As expected, patients on either protocol had elevated HbA1cs ~7.3% in both basal-bolus groups (Figure 9A). Additionally, looking at the average blood glucose within each group at 9 different timepoints throughout the day, patients in both groups had blood glucose levels that averaged well above the normal range (130-200mg/dL; Figure 9C).

Figure 9 Basal Bolus Protocol Using Two Different Basal Insulins. Basal glargine (Lantus, n=157) or basal degludec (n=472) plus rapid-acting insulin (Heller et al., 2012).
These three studies (and others) are not meant to focus on the types of insulin’s used, but instead to clearly indicate that the Basal-Bolus Protocol does not normalize glycemic control using traditional dietary recommendations (Alemzadeh et al., 2005; Cherubini et al., 2006; Heller et al., 2012). These therapies still consistently result in HbA1c ≥5.7% and average blood glucose well above 80-120mg/dL (Table 2, Figure 8-9).
Why are these therapies inadequate for the normalization of blood glucose levels? In theory, exogenous insulin kinetics should cover the glucose kinetics of meals (Figure 7), but it does not. It still results in glycemic mismanagement due to a number of factors presented in Part 1: Daily Factors Influencing Glycemic Control.
Factors That Influence Insulin Requirements:
Hypothetical Equation 1 provides a mathematical model for understanding how combining Carbohydrate Counting with the Basal-Bolus Protocol does not reliably result in controlled or predictable blood glucose outcomes. This equation is not meant to predict exact numerical outcomes, but instead provide a mental map for the variables that contribute to the net change in blood glucose when ingesting a meal and taking exogenous insulin.

Hypothetical Equation 1: Net Change in Blood Glucose
Carbohydrates: Carbohydrates directly and rapidly raise blood glucose. The more carbohydrates consumed, the higher the blood glucose levels (see Section 1 and above). The higher the blood glucose levels, the more insulin required to manage the blood glucose elevation.
Controlled? Grams of carbohydrates can be measured and thus provide a “controlled” equation variable.
Predictable? Carbohydrate’s influence on net change in blood glucose is sometimes predictable, sometimes unpredictable (unpredictability is influenced by below factors).
Protein: Protein indirectly raises blood glucose (see above). However, protein per gram stimulate ~60% less insulin compared to carbohydrates per gram (Collier & O'Dea, 1983). Consequently, the blood glucose elevating effect of protein is divided by ~2.5.
Controlled? Grams of protein can be measured and thus provides a controlled equation variable.
Predictable? Protein’s influence on net change in blood glucose tends to be predictable.
Blood Glucose Flux: A host of factors can cause blood glucose to be released into the blood stream independent of food, including glycogenolysis and gluconeogenesis (Section 1-Daily Factors Influencing Glycemic Control; Section 1 - Figure 11&12). Alternatively, several (albeit less potent) factors can lead to decreases in glucose from the blood stream, independent of insulin.
Controlled? Blood glucose flux’s influence on net change in blood glucose provides a less controlled variable in the equation due to its lack of predictability.
Predictable? Blood glucose flux is very difficult to predict. A Type-1 Diabetic who has a very consistent schedule and is very aware of their blood glucose changes may be able to predict the timing and quantity of blood glucose flux with more accuracy. However, for the average Type-1 Diabetic, it provides a less predictable variable in the equation.
Insulin’s Blood Glucose Lowering Effect: Insulin lowers blood glucose (Section 1). However, the amount insulin lowers blood glucose is multiplied by BOTH insulin sensitivity factors (Section 1) and the total amount of insulin administered. Consequently, this produces one of the influential, yet unpredictable, variables on net change in blood glucose.
Controlled? Insulin’s blood glucose lowering effect is very difficult to control. Many variables have a large and direct influence on this variable and consequently it represents a less controlled variable.
Predictable? Insulin’s blood glucose lowering effect is a very difficult to predict because of the number of variables that influence it throughout the day (Section 1). This is another variable which can be much more predictable in individuals with a more consistent lifestyle.
Host of Insulin Sensitivity Factors: Insulin sensitivity is constantly changing throughout the day (Section 1-Figure 11). The factors influencing insulin sensitivity can multiply or divide the blood glucose lowering effect of insulin.
Controlled? Insulin sensitivity factors are less controllable. An individual can influence these variables, but it does not represent a “controlled” variable in most Type-1 Diabetics’ lives.
Predictable? Insulin sensitivity factors are unpredictable for most Type-1 Diabetics. While many Type-1 Diabetics with a consistent lifestyle and close awareness of their individual influence on insulin sensitivity can better predict their influence on this variable, it is difficult to fully predict.
Insulin (International Units; IU): The blood glucose lowering effect of insulin is proportional to the amount of insulin administered (IU). However, insulin’s blood glucose lowering effect is multiplied or divided by how sensitive the body is while it is still kinetically present. Additionally, the type of insulin and rate of absorption also play an important role in how quickly or slowly the new change in blood glucose will occur (Figure 5 & Table 1).
Controlled? Quantity of insulin is a measurable and controlled input into the equation.
Predictable? Quantity of insulin provides an unpredictable influence over the net change in blood glucose due to the other variables indirectly influencing the quantity of the net change in blood glucose.
Metabolism is not stagnant. It is often dynamically changing due to both acute and chronic factors that influence insulin sensitivity and blood glucose flux. Some of these factors are controllable and/or predictable, some are not. This can often generate unpredictable outcomes for Type-1 Diabetics trying to manage blood glucose levels. This problem becomes multiplied if a Type-1 Diabetic is consuming large quantities of carbohydrates which require large quantities of insulin. Equation 1 and Figure 10 both demonstrate that the higher the insulin used, the greater the potential for unpredictable blood glucose changes (blood glucose deviation from the mean). Consequently, each meal becomes a dynamic mathematical guessing game with insulin. Predicting insulin requirements to prevent elevations in blood glucose is often uncontrollable and unpredictable, and certainly is not as simple as matching grams of carbohydrates to IUs of insulin.

Figure 10 Insulin’s Influence on Potential for Standard Deviation in Mean Blood Glucose. With great insulin load, the greater the chance for a blood glucose fluctuation if the Type-1 Diabetic guesses incorrectly when mathematically calculating their insulin need based on the factors in Hypothetical Equation 1.
Real World Example:
Part 1 – Figure 10 (below) represents my own personal data while temporarily switching back to a high carbohydrate diet utilizing a Basal-Bolus Protocol to retest this approach. You can see how the fluctuations in blood glucose are vast and not consistent day-to-day, or meal-to-meal. It constantly changes, resulting in larger blood glucose fluctuations. Sadly, Section 1-Figure 10 represents “more controlled” blood glucose numbers (better average blood glucose and standard deviations) than the typical Type-1 Diabetic is reported to experience. These fluctuations could be argued to originate because of the various factors that introduce metabolic variability (Section 1 - Figure 11) into Hypothetical Equation 1, making insulin’s blood glucose lowering effect unpredictable.


Section 1 - Figure 11 Factors Contributing to Standard Deviation in Type-1 Diabetic Glycemic Control. Yellow lines represent deviation above normal blood glucose. Red lines represent deviation below normal blood glucose.
Type-1 Diabetes is an autoimmune disease without a cure. Unfortunately, the standard of care for Type-1 Diabetes is unable to normalize glycemic control, resulting in both increased risk for acute stressful events and later for additional devastating chronic diagnoses. The lack of success from all these approaches is likely attributed to the unpredictable and uncontrollable nature of our metabolism (blood glucose and insulin kinetics), which is exacerbated by higher insulin loads. This presents a difficult reality for most Type-1 Diabetics. However, do we as Type-1 Diabetics have to accept this? I believe the answer to that question is a resounding “NO”. Understanding the factors that introduce variability into glycemic control can allow a Type-1 Diabetic to better control and predict them, allowing a Type-1 Diabetic to mitigate the potential negative impacts on glycemic management.
Very-Low Carbohydrate Dietary Approach
Personal Introduction into Very Low Carbohydrate Approach:
Living with Type-1 Diabetes over the past 12 years, I have tested and analyzed my blood more than 50,000 times, injected myself with over 60,000 insulin syringes, taken over 300,000 IUs of insulin and tried a host of different nutritional and lifestyle strategies for disease management. Within my varied experiences, I have yet to find a nutritional approach outside of the very-low carbohydrate diet which reliably helps me to maintain stable blood glucose.
DISCLAIMER: This information is based on my own personal experience and should not be taken as medical advice. Many variables influence glycemic control and thus each Type-1 Diabetic must determine what is best for themselves with the guidance of their physician. Instead, this information is meant to provide an overview of my own personal method of maintaining glycemic control in the hopes of providing a beacon of light to others on this journey.
Dietary Regimen:
Previous Dietary Regimen:
3 Meals/Day
High Carbohydrate (200-400g carbohydrates/day):
Potatoes, rice, oatmeal, fruits, etc.
Green Leafy Veggies on side
High Protein (200-300g protein/day):
Lean Sources of Protein: Chicken breast, Tuna, Egg Whites, Low-Fat Yogurt, Whey Protein
Occasional Fatty Protein Source: Salmon or Beef
Low Fat (<100g/day):
Residual Fat from other nutrient sources or Olive Oil, Peanut Butter, etc… on side
Current Dietary Regimen:
2-3 Meals/Day
Very-Low Carbohydrates (~<50g/day; <10% total daily kcals):
High Fiber, Low Carbohydrate Green Leafy Veggies
Excludes: Starchy and Sugar Foods
High Protein (200-300g protein/day):
Lean or Fatty sources of Protein: Fish, Meat, Eggs, Low-Carbohydrate Beans, Cheeses, Whey Protein, etc.
Variable Fat (~200g/day):
Fat from Protein Sources, Olive Oil, Nuts (Whole and Buttered), MCT, Coconut Oil, etc…
Occasional: Almond flour, Coconut flour, Butter

Figure 11 ADA “Create Your Plate” Modified for a Very-Low Carbohydrate Diet. (American Diabetes, 2018b)

Figure 12 Very-Low Carbohydrate Diet Food Examples. Top left: eggs and brussel sprouts. Top right: chicken and salad (spinach, olive oil, feta cheese, onions, olives, tomatoes); Bottom left: bacon, walnuts, egg omelet; Bottom center: ribeye steak and broccoli; bottom right: home-made low carbohydrate pumpkin bread (modified this recipe: http://www.carolinesketokitchen.com/2016/10/chocolate-chip-pumpkin-muffin.html)
Previous Insulin Regimen:
Basal-Bolus Protocol:
Basal: 1xNight Long-Acting Insulin (Lantus) or Continuous Pump Infusion of Rapid Acting Insulin (Novolog)
Bolus:
Carbohydrates: Rapid-Acting Insulin per gram of carbohydrate consumed
Protein: Regular-Acting Insulin per gram of protein consumed
Correcting Blood Glucose (>120mg/dL): Rapid-Acting Insulin
Current Insulin Regimen:
Basal-Bolus Protocol:
Basal: Intermediate-Acting Insulin 2x/day (Morning and Night Levemir)
Bolus:
Carbohydrates: Rapid-Acting Insulin per gram of carbohydrate consumed
Protein: Regular-Acting Insulin (Humulin-R or Novolin-R) per gram of protein consumed
Correcting Blood Glucose (>120mg/dL): Rapid-Acting Insulin as needed

Figure 13 Previous vs Present Insulin Regimen. Left Top: Lantus+Novolog+Humulin-R; Bottom Left: Continuous Pump Infusion Novolog+Humulin-R; Right: Levemir+Novolin-R+Novolog
Results:
Insulin Requirements:

Figure 14 Estimated Daily Insulin Requirements on Dietary Regimens. Previous High Carbohydrate Dietary Regimen (left) required ~40IU Lantus, ~40IU Novolog, ~10IU Humulin-R. Current Very-Low Carbohydrate Dietary Regimen (right) required ~20IU Levemir and 10IU Novolin-R.
While on a high carbohydrate diet, I was consuming 200-400g carbohydrates a day (~50-100g carbohydrates/meal). Consequently, I was required to administer a tremendous amount of insulin for each meal. This, combined with basal insulin, resulted in ~80-100IU insulin/day (depending on acute and chronic insulin sensitivity factors). However, currently, I am administering less than 30IU of total insulin per day (20-30IU). This means a reduction in total diabetic medication requirements and costs, but also estimated 70% reduction in one of the biggest factors that can cause fluctuations in glycemic control: insulin (Figure 14).
Blood Glucose Trends/Stability:
In Figure 15, my blood glucose trends are illustrated. These graphs represent two distinct dietary approaches, high carbohydrate (left graph) and very-low carbohydrate (right graph). As seen in the left graph, I had a 122mg/dL average blood glucose with a 50mg/dL standard deviation. This indicates that my blood glucose would shift, on average, 50mg/dL above 122mg/dL and 50mg/dL below 122mg/dL. This standard deviation represents meal-by-meal shifts from hyperglycemia to hypoglycemia and back again. Some days were more stable while others were much less stable. The graph on the right represents much more stable blood glucose throughout the day, with a 93mg/dL average blood glucose and 19mg/dL standard deviation.

Figure 15 Representation of Weekly Blood Glucose Trends on Two Distinct Dietary Regimens. Left graph: High carbohydrate diet paired with Basal-Bolus Protocol (Rapid+Regular-Acting Insulin Boluses). Average blood glucose of 122mg/dL and a standard deviation of 50mg/dL. Right graph: Very-low carbohydrate diet paired with Basal-Bolus (Regular Insulin-Boluses). Average blood glucose of 93mg/dL and a standard deviation of 19mg/dL.

Figure 16 90-Day Blood Glucose Average on Very Low Carbohydrate Diet
Figure 16 illustrates what average blood glucose looked like for me over a 90-day period on a very-low carbohydrate diet when paired with basal-bolus protocol.
How do these very-low carbohydrate blood glucose trends compare to typical Type-1 Diabetic trends?
If you compare the 19mg/dL standard deviation to the average standard deviations in Kuenen et al. 2011 (Table 3), less than 30mg/dL standard deviation was only present in 3.4% of Type-1 Diabetics (Kuenen et al., 2011).
Average Blood Glucose Levels (HbA1c):

Table 3 Blood Glucose Standard Deviations in Type-1 (and 2) Diabetics. Red Blood represents the % of Type-1 Diabetics with similar blood glucose standard deviations (3.4%). Table 1 from (Kuenen et al., 2011).
The best predictive marker for Type-1 Diabetic outcomes is HbA1c. My most recent HbA1c using my current very-low carbohydrate regimen was 4.9% as shown below (Figure 17). This 4.9% HbA1c translates to a 2-3 month average of ~94mg/dL (American Diabetes). How does this compare to typical Type-1 Diabetic HbA1c? Compared to data of more than 25,000 Type-1 Diabetics from T1D Exchange, 0.1% of Type-1 Diabetics have an HbA1c less than 5.0% [Figure 18; (Exchange)]. A 4.9% HbA1c is within the normal health HbA1c range. In fact, the average HbA1c of normal healthy individuals between the age of 5-24 years of age is 4.99%, placing my HbA1c right at this average (Saaddine et al., 2002).

Figure 17 Current HbA1c Compared to Average Type-1 Diabetics (Pinhas-Hamiel et al., 2014) and Diabetic Diagnostic Category Range (American Diabetes, 2016)
Combining Macronutrients and Insulin on Very-Low Carbohydrate Regimen:

Figure 18 4.9% HbA1c in T1D Exchange Database (Exchange).
Reflect back to Collier et al. 1983 [Figure 19; (Collier & O'Dea, 1983)]. We see from these images that the Protein and Protein+Fat insulin response is delayed, smaller, and prolonged. This tells us that to match the insulin requirements of a Protein+Fat meal, which has a delayed onset, does not peak right away, and has a prolonged response that lasts for more than 240minutes, we would anticipate that we would need ~2.5x less insulin. It has been my experience and the experience of hundreds of Type-1 Diabetics that I have communicated with that Regular-Acting Insulin (Humulin-R or Novolin-R) matches the blood glucose kinetics of Protein or Protein+Fat. Rapid-Acting insulin appears to peak too quickly and exhaust its glucose lowering effect too rapidly. For me, this has been one of the biggest advantages of the very-low carbohydrate approach, a blood glucose and insulin kinetic match! An additional advantage to this Protein+Fat insulin regimen is that the blood glucose elevation from a protein-based meal and the blood glucose lowering effect of regular-acting insulin are slower and smaller. Consequently, dramatically reducing the potential for rapid blood glucose swings. Even though there are many factors that still influence blood glucose control and insulin sensitivity (Section 1) regardless of dietary regimen, these factors produce much less blood glucose variability when the insulin load is much smaller and delayed. This produces a much safer blood glucose environment for Type-1 Diabetics.

Figure 19 Insulin Response to 50grams of Carbohydrates or Protein With or Without Co-Ingestion of 50grams of Fat. Modified Figure 1 and 2 from (Collier & O'Dea, 1983).
Benefits:
Lower Insulin Requirements for Very-Low Carbohydrate Nutritional Composition
Slower Shifts in Blood Glucose from Both Protein+Fat Nutrition and Regular-Acting Insulin
Blood Glucose Response to Protein+Fat Meal Matches Exogenous Regular-Acting Insulin Kinetics
Does this Low Carbohydrate Approach Normalize Glycemic Control?
My anecdote (n=1) only provides one case, but what about studied examples of Very-Low Carbohydrate Diets in Type-1 Diabetics? Is this a new idea?

This is certainly not a new idea. In 1920, Newburgh & Marsh published the first report of a very low-carbohydrate high fat diet for Type-1 Diabetes treatment (Newburgh & Marsch 1920). A year later, Woodyatt went on to describe the use of various dietary therapies, with focus on very low-carbohydrate diets, as a tool for managing glycemic control (Woodyatt 1921). However, with the advent of insulin, the diet fell out of favor as it was viewed as too restrictive.

Turton et al. 2018 provided a review of all the current Type-1 Diabetes studies that had a carbohydrate intake less than 45% of total kcal and showed adherence to diet for at least 2 weeks (Turton et al., 2018). Why these criteria? The author classified low-carbohydrate as anything below the “Acceptable” Macronutrient Distribution Range (AMDR). The AMDR for carbohydrates is 45-65%. Consequently, anything below 45% kcal is considered “low carbohydrate” for this study analysis. However, a Very-Low Carbohydrate Diet (<50g carbohydrates/day) is not the same as a Low-Carbohydrate Diet (<26-45% carbohydrates/day) and is important for the reader to distinguish. The Very-Low Carbohydrate Diet (<50g carbohydrates/day) is the form of this dietary regimen that the general public has become most familiar with in recent years (Feinman et al., 2015). Consequently, the authors of this study further categorized “low carbohydrate” into 3 categories (Turton et al., 2018)
False Low Carbohydrate (FLCD): <45 - >26%kcal carbohydrates
True Low Carbohydrate (TLCD): <26%kcal carbohydrates
Very-Low Carbohydrate Ketogenic Diet (VLCKD): <50g carbohydrates/day
What about adherence? A minimum of 2-week adherence provides a great starting point, but certainly does not provide enough time to truly evaluate the glycemic control of any intervention. Ideally, 3-months is a better timeline to see tangible changes in markers like HbA1c. Nonetheless, these criteria are likely chosen simply because there are not many studies in Type-1 Diabetics using a low-carbohydrate diet. Thus, allowing for more flexibility in inclusion criteria allows for a more robust analysis.
The authors were not able to draw any conclusions as to whether low carbohydrate (<45%kcal carbohydrates) significantly improved glycemic control based on the available studies that fit their inclusion criteria. Table 4 provides the findings from the studies analyzed. In Table 4, the authors indicated the amount of carbohydrates consumed per day (CHO), what type of low carbohydrate diet it was (FLCD, TLCD, or VLCKD), the duration of the intervention (follow-up), as well as indicated the outcomes pre and post for HbA1c, incidence of hypoglycemia, total insulin intake, etc.

Table 4 Glycemic Outcomes in Low-Carbohydrate Diet Variations in Type-1 Diabetics. Modified Table 2 from (Turton et al., 2018).
1. HbA1c:
FLCD: No consistent improvements found
TLCD: No consistent improvements found
VLCKD: Both trials lowered HbA1c to within the normal health non-diabetic range (5.5% and 5.3%). No other report has shown the ability to lower HbA1c into the normal range except islet cell transplants.
2. Severe Hypoglycemia:
FLCD: Only one trial was shown, and it lowered hypoglycemia incidence from 3.7 to 0.2.
TLCD: Only one trial was shown, and it lowered hypoglycemia incidence from 730 to 12.
VLCKD: No reports
3. Total Daily Insulin:
FLCD: No reports
TLCD: ¾ reported lower insulin dose
VLCKD: One report and it indicated lower insulin dose
Table 5 illustrates the 3 studies up to 2018 that assessed glycemic management in Type-1 Diabetics using a very low-carbohydrate ketogenic diet (Eiswirth, Clark, & Diamond, 2018; O'Neill, 2003; Vernon, Mavropoulos, Transue, Yancy, & Westman, 2003). This data is encouraging, but extremely limited.

Table 5 Glycemic Management in Type-1 Diabetics on Very-Low Carbohydrate Diet. Data illustrates impressive, but very limited data on glycemic management in Type-1 Diabetics on a very low-carbohydrate ketogenic diet (O'Neill, 2003; Vernon, Mavropoulos, Transue, Yancy, & Westman, 2003).
While not many conclusions can be made from the studies included in this analysis (more studies are needed), the two studies that did evaluate a VLCKD showed normalized glycemic control and lowered insulin requirements which has not been reported outside of islet cell transplantation (Section 2). This presents a potential solution, the caveat being that analysis in these studies was limited and more robust data are needed.


Following this review, however, the largest study to date utilizing the very-low carbohydrate diet in Type-1 Diabetics was published by a group of researchers and clinicians from Harvard, Duke, and Indiana University, amongst others (Lennerz et al., 2018). This study looked at a community of Type-1 Diabetics called TYPEONEGRIT. This community includes Type-1 Diabetics and caregivers who are utilizing a very-low carbohydrate diet along with many of the principles outlined in Dr. Richard Bernstein’s Diabetic Solutions Book (Bernstein, 2011). This group’s motto is that Type-1 Diabetics can and should achieve the same blood glucose control as their non-diabetic peers.

This book guides both Type-1 and Type-2 Diabetics on how to implement a very-low carbohydrate diet (typically 30g or less). It also discusses diabetic tools, exercise, oral and injected diabetic medications, managing expected and unexpected influences over glycemic control, and more. I can attest that this book is one of the most comprehensive guides available on glycemic management.
This 2018 study collected doctor-confirmed medical records from both children and adult Type-1 Diabetics within the Type-1 Grit community (Lennerz et al., 2018). To be included in the study, the participants had to satisfy 3 criteria:
Have Type-1 Diabetes
Receiving Insulin Therapy
Consuming a Very-Low Carbohydrate Diet for at least 3 months.
Results?
Glycemic Control:
In 300 participants utilizing a very-low carbohydrate diet who reported HbA1c, the average was 5.67% (~116mg/dL; Figure 20). These researchers also verified blood glucose levels with continuous blood glucose monitoring devices. Continuous glucose monitoring illustrated that most patients achieved an average blood glucose of 104mg/dL with a standard deviation of 28mg/dL/. This represents an HbA1c that only 1.28% of Type-1 Diabetics achieve (Exchange) and also a standard deviation that less than 4% of Type-1 Diabetics achieve(Kuenen et al., 2011).
Adverse Events:
This study found that individuals had an extremely LOW incidence (~2% of participants) of severe diabetes- related adverse events (diabetic ketoacidosis, hypoglycemia, seizures, coma, etc.) while on this dietary regimen (Table 6).

Figure 20 HbA1c in Type-1 Diabetics Using a Very-Low Carbohydrate Diet. Figure 1 from (Lennerz et al., 2018).

Table 6 Participant-Reported Clinical Variable from Type-1 Diabetics on Very-Low Carbohydrate Diet. Table 2 from (Lennerz et al., 2018).
Health and Health Care Satisfaction:
The researchers were also interested in how patients AND health care providers (doctors treating the patients) felt about the patient’s treatment strategy using several metrics:
1) Patient reported assessment of overall health on a very-low carbohydrate regimen
97% of patients reported Good to Excellent overall health
2) Patient reported satisfaction with diabetes control achieved on the very-low carbohydrate regimen
87% of patients reported Satisfied to Very Satisfied with diabetes control
3) Patient reported satisfaction with their doctors
50% of patients reported Satisfied to Very Satisfied with their doctors
27% of patients reported Dissatisfied to Very Dissatisfied with their doctors
4) Patient reported assessment of the therapeutic response to the very-low carbohydrate regimen
97% of patients reported Good to Excellent therapeutic response
5) How many patients did not discuss their very-low carbohydrate treatment strategy with their doctors
27% of patients did not discuss their diet with their doctors
6) Doctor reported support of the very-low carbohydrate regimen
49% of doctors reported agreeing to strongly agreeing with the nutritional approach of patient
20% of doctors reported disagreeing or strongly disagreeing with the nutritional approach of the patient

Table 7 Participant- and Doctor-Reported Health and Diabetic Care Satisfaction. Table 3 from (Lennerz et al., 2018).
Were there any implications to this approach? Virtually all patients from this study felt that the very-low carbohydrate regimen improved their overall health and helped management their disease (which is reflected in the glycemic control reported in Figure 20 and Table 6). However, interestingly, but also of concern, is that a ¼ of all the patients using this approach did not discuss this approach AT ALL with their doctors...This create a potentially dangerous patient-doctor relationship. Why would a patient not communicate their disease management strategy with the one person who is supposed to help them the most, their doctor? Some doctors are not supportive of this dietary approach. Consequently, patients are more inclined to simply avoid any potential criticism from their doctor. There have also been a few reported circumstances where physicians have called Child Protective Services on parents who put their children on a very-low carbohydrate dietary regimen…I have communicated with many parents with Type-1 Diabetes and unfortunately this fear is very common among parents.
Are these findings consistent? (Update 9/11/19) Since Turton et al. 2018 meta-analysis, there have been 4 more analysis in Type-1 Diabetic’s where ≤50g carbohydrates/day where ingested (Table 8). In ALL analysis of atleast 3months in length, Type-1 Diabetic patients on a VLCD were able to consistently normalize HbA1c’s into normal non-diabetic range (Eiswirth et al. 2018; Leow et al. 2018; Lennerz et al. 2018; O'Neill, 2003; Vernon, Mavropoulos, Transue, Yancy, & Westman, 2003). Ranjan et al. 2017 looked at 10 Type-1 Diabetic patients on either a isocaloric standard diet (227g carbohydrates/day) or a VLCD (47g carbohydrates/day) for 7 days. While this trail is too short to evaluate changes in HbA1c (HbA1c estimated blood glucose levels over a 2-3 month period), it did demonstrate a 44% decrease in insulin requirements, a 27% reduction in blood glucose standard deviation, less hypoglycemic events, and more time in euglycemia (which they defined as 70-180mg/dL) even in this short study window (Ranjan et al. 2017). Eiswirth et al. 2018 was a case-report of a female Type-1 Diabetic who had a reported 7.5% HbA1c for 3 years straight and decided to undergo a VLCD (30-50g carbohydrates/day; Eiswirth et al. 2018). This analysis reported that her HbA1c reduced to 5.3%, average blood glucose reduced from 187.2mg/dL to 110mg/dL, had no significant hypoglycemic events reported, no adverse lipid changes, and subjective improvements in quality of life. Leow et al. conducted an observation analyses of 11 Type-1 diabetic patients who consumed an average of 28.9g carbohydrate/day over a mean 2.6 years. This analyses reported an average CGM blood glucose of 106mg/dL, 5.3 HbA1c, 27mg/dL blood glucose standard deviation, and 74% of the time in euglycemia (defined as 70-144mg/dL; Leow et al. 2018). However, this analysis indicated that these participants experienced hypoglycemic moments (defined as <54mg/dL) 3.6% of the day and LDL Cholesterol was elevated (above historical normal reference range values). Consequently, these authors concluded that a VLCD was associated with exceptional glycemic control, but may elevate risk for hypoglycemia and dyslipidemia. However, in this study cohort, the incidence of hypoglycemia could potentially be corrected if the target blood glucose was elevated as they showed exceptionally tight glycemic control. To do, these studies illustrate VLCD can induce exceptional glycemic control. However, as Leow et al. demonstrated, some within the medical community are concern about the potential side effects of this diet (discussed in detail below).

Table 8 Up-To-Date (since 9/11/19) Glycemic Management in Type-1 Diabetics on Very-Low Carbohydrate Diet. Current data on VLCD with ≤50g carbohydrates/day in Type-1 Diabetics. This data illustrates that in ever trials where VLCD was evaluated for atleast 3 months, Type-1 Diabetic’s were able to achieve non-diabetic HbA1cs, demonstrate very small blood glucose standard deviation, and lower insulin quantity (or demonstrate low insulin requires against historical references). *Only one analysis demonstrated an HbA1c outside of the normal range, non-diabetic range (Ranjan et al. 2017). However, Ranjan et al. (2017) was only a 7 day trial which is too short of a trial (HbA1c reflects average glucose levels over 2-3 months) to accurately evaluate diet-induced changes on HbA1c. (Eiswirth et al. 2018; Leow et al. 2018; Lennerz et al. 2018; O'Neill, 2003; Ranjan et al. 2017; Vernon, Mavropoulos, Transue, Yancy, & Westman, 2003).
Why would a physician have negative feelings towards a very-low carbohydrate diet? Why would patients not want to communicate with their doctor that they are using this dietary approach? This leads into the next section where I provide the arguments for and against criticisms and/or limitations of this dietary strategy.
Limitations/Criticism of the Diet:
1. High Dietary Fat Intake?:
Argument: Many health care providers will cringe when you tell them you are consuming extremely high levels of dietary fat. This reaction is a consequence of years of research showing adverse health outcomes when elevating fat intake (~45-60%kcal) on a diet that already has an elevated level of carbohydrates (>10%kcal). This dietary composition is termed a “High Fat Diet” which has a similar composition to the “Western Diet.” This “High Fat Diet” usually means 20-40%kcal carbohydrates and 45-60%kcals fat and is often associated with obesity and caloric overconsumption (Envigo; Schrauwen & Westerterp, 2000). Thus, a “High Fat Diet” means high fat while still consuming sufficiently high carbohydrates. “Sufficiently” high carbohydrates attenuate the body’s ability to undergo the metabolic shift away from glucose-based metabolism, towards fat- and ketone-metabolism. This shift towards primarily fat- and ketone-based metabolism usually requires carbohydrate intake as low as 20-50g/day.
Counter-Argument: A “High Fat/Western Diet” is NOT the same as a very-low carbohydrate diet. Carbohydrates on a very-low carbohydrate diet are typically ≤5-10% of total daily caloric intake, not ≥20%. A very-low carbohydrate diet is not typically associated with overconsumption or obesity, while a “high fat diet” is (Envigo; Feinman et al., 2015; Paoli, Rubini, Volek, & Grimaldi, 2013; Schrauwen & Westerterp, 2000). A very-low carbohydrate diet has been associated with many beneficial health outcomes (Paoli et al., 2013). The very-low carbohydrate diet should not be confused with dietary strategies where carbohydrate intake is greater than 10-15% of total kcals consumed (Feinman et al., 2015).
2. LDL Cholesterol?:

Table 9 Type-1 Diabetic Lipid Levels Utilizing a Very-Low Carbohydrate Diet. Table 2 from (Lennerz et al., 2018).
Argument: Elevated LDL Cholesterol has been associated with adverse cardiovascular outcomes in several clinical and epidemiological studies (Ference et al., 2017). LDL Cholesterol has been reported to be greater than 130mg/dL on a very-low carbohydrate dietary regimen in Type-1 Diabetics [Table 9;(Lennerz et al., 2018)]. As such, many endocrinologists may be concerned about any dietary therapy that may cause elevated LDL Cholesterol, especially in a disease population who may already be at increased risk for cardiovascular disease (Conway, Lopes-Virella, & Blot, 2018; Livingstone et al., 2015; Livingstone et al., 2012; Soedamah-Muthu et al., 2006).
Counter-Argument: LDL Cholesterol has been a point of debate for many years over its causal versus associative role in cardiovascular disease (DuBroff, 2017). A very-low carbohydrate diet typically changes blood lipids in three ways (Bhanpuri et al., 2018; Dashti et al., 2004; Feinman et al., 2015; Lennerz et al., 2018; Nordmann et al., 2006):
Lowers Triglycerides
Raises HDL Cholesterol
No Change or Raises LDL Cholesterol
While LDL Cholesterol may be elevated on this dietary strategy [although not consistently reported (Hu & Bazzano, 2014)], the triad of lipid outcomes (lower triglycerides, elevation of HDL Cholesterol, and elevation in LDL Cholesterol) has NOT been associated with adverse cardiovascular outcomes. Additionally, evidence seems to indicate that LDL particle size (small dense “Pattern B” LDL particles; different from LDL Cholesterol) may be a much stronger predictor of cardiovascular disease than LDL Cholesterol in the blood (Austin et al., 1988; Williams et al., 2003). Thus, while LDL Cholesterol may increase on very-low carbohydrate diet, LDL particle and small dense Pattern B LDL particles have been shown to decrease (Bhanpuri et al., 2018). Therefore, while LDL Cholesterol plays an important role in cardiovascular disease, simply looking at LDL Cholesterol may not be sufficient to draw concern about an individual’s cardiovascular risk. Additionally, the strongest predictor of cardiovascular disease in Type-1 Diabetics is HbA1c and Triglycerides, both of which have shown to be markedly improved on the very-low carbohydrate diet (Diabetes, Complications Trial/Epidemiology of Diabetes, & Complications Research, 2016). Considering all the patient’s risk factors together may provide a more accurate assessment of true cardiovascular risk.
3. Compliance?:

Figure 21 Grocery Store Limitation for a Very-Low Carbohydrate Diet.
Argument: Compliance with any dietary strategy is always a concern, especially on a restrictive diet (Dansinger, Gleason, Griffith, Selker, & Schaefer, 2005; Gardner et al., 2018). The very-low carbohydrate diet is not an exception to this problem. While many people love and prefer the very-low carbohydrate diet food options and some trials have shown great compliance on the diet where encouragement was given (Hallberg et al., 2018), it would be inaccurate to portray this diet as a “cake walk.” It takes time to understand the food options that are and are not allowed on this dietary strategy. On this dietary strategy, you are typically walking away from 60% of the grocery store which includes starchy, sugary carbohydrates (Figure 21). You are giving up an entire food group (carbohydrates). Does that mean you are giving up your favorite foods? Maybe, but maybe not.
Counter Argument: All diets have the same adherence issues (Dansinger et al., 2005). Additionally, now there are recipes readily available where you can make many of the foods typically associate only with a high carbohydrate diet by recreating them using low glycemic ingredients (i.e. coconut flour, almond flour, unsweetened dark chocolate, stevia, erythritol, allulose, psyllium husk, etc.). Caroline’s Keto Kitchen is a great resource for this (http://www.carolinesketokitchen.com). This site is maintained by a Type-1 Diabetic who follows a very-low carbohydrate approach. She provides numerous recipes which allows for Type-1 Diabetics to recreate pizza, donuts, cookies, cakes, etc… that do not result in high blood glucose levels. I have personally made many of these recipes without having the typical blood glucose elevations you would normally see with the high glycemic ingredients. I also find these foods often taste as good as the “original.” That said, there are now NUMEROUS free and paid resources that help guide individuals on how to make good, tasty, and sustainable foods while on this nutritional approach. Additionally, while dietary changes are often difficult for many to implement and maintain, the improvements in quality of life achieved from having glycemic control may improve compliance.
4. Children’s Growth?:
Argument: There has been concern raised about children utilizing a very-low carbohydrate diet because some reports have indicated that a restrictive ketogenic diet may stunt growth in a some seizure patients using a restrictive ketogenic diet (90% total kcals from fat) to manage their seizures (Vining et al., 2002).
Counter-Argument: The very-low carbohydrate diet used in the Pediatric papers (Lennerz et al., 2018) did not include the level of protein restriction used in many restrictive ketogenic diets used with seizure patients (Vining et al., 2002). Additionally, the Pediatrics paper showed no indication that the very-low carbohydrate diet blunted or inhibited growth in children (Lennerz et al., 2018). In fact, it showed the opposite. It is equally important for patients and doctors to consider the well-known data that has shown that poor glycemic control DOES blunt/inhibit optimal growth in children (Bonfig et al., 2012; Frohlich-Reiterer et al., 2011; Hannon & Rogol, 2012; Khadilkar et al., 2013; Parthasarathy, Khadilkar, Chiplonkar, & Khadilkar, 2016). Hopefully more research will emerge evaluating these outcomes in Type-1 Diabetics (Lennerz et al., 2018).
5. Long-Term Health Data on Very-Low Carbohydrate Diet?:
Argument: There is not any epidemiological data looking at the long-term outcomes of individuals on a very-low carbohydrate diet. Some have argued that implementing this diet long-term may have adverse health outcomes. However, this is largely based on speculation around long-term high fat intake and higher LDL Cholesterol leading to adverse health outcomes (addressed above).
Counter-Argument: It is critical to remember that it is WELL KNOWN what the long-term outcomes are with the standard dietary recommendations used for most Type-1 Diabetics: poor glycemic control (Section 2). Thus, currently, the speculation about the unstudied long-term outcomes surrounding a very-low carbohydrate diet for Type-1 Diabetics seem to pale in comparison to the potential long-term health benefits derived from normalizing glycemic control. Additionally, there are currently four studies evaluating this dietary approach in aging rodents (Douris et al., 2015; Newman et al., 2017; Parry HA, 2018; Roberts et al., 2018). These results all indicate positive aging benefits associated with the diet. Hopefully, we will see much more research emerge on this topic.
6. Ketoacidosis/Dangers of Ketones?:
Argument: When Type-1 Diabetics undergo autoimmune destruction of insulin-producing beta-cells, Type-1 Diabetics can begin to enter ketoacidosis. Thus, there is concern that a VLCKD which increases ketone production, may increase the risk of ketoacidosis in Type-1 Diabetics.
Counter-Argument: While pathological ketoacidosis involves the uninhibited up-regulation of ketone body production, this is should not be confused with nonpathological VLCKD physiology. Hallmark characteristics of ketoacidosis and VLCKD are portrayed in Table 10.

Table 10 Physiological Differences Between Ketoacidosis and Very-Low Carbohydrate Diet. Ketoacidosis involves dangerously low or absent insulin which causes glucose and ketone levels to rise. A VLCKD has low to moderate insulin which is sufficient to control blood glucose in the homeostatic range while allow low to moderate elevations in ketone bodies. This pathological (ketoacidosis) versus nonpathological (VLCKD) physiological states are vastly different.
Ketoacidosis involves zero or dangerously low insulin, combined with extremely high blood glucose (>250mg/dL) and ketone levels (>10mM). When beta-cell function declines and exogenous insulin is not administered, the body tissues can become starved of energy as glucose cannot be transported from the blood stream into tissues (i.e. skeletal muscle and adipose tissue; See Part 1). Consequently, the body tries to supplement this energetic deficit by rapidly increasing fat mobilization and oxidation, followed by increasing ketone production and oxidation. Normally, endogenous insulin would inhibit these processes, but this is absent in Type-1 Diabetics unless exogenous insulin is administered.
Conversely, a prolonged state of carbohydrate restriction (VLCKD) is a nonpathological scenario where insulin is low to moderate, but not zero or extremely low. With low to moderate insulin levels, the body begins to shift from a predominantly glucose-based metabolism, to a predominantly fat and ketone-based metabolism (Volek et al., 2016). This shift is termed fat/keto-adaptation. This state results in low to moderate insulin, control blood glucose (70-110mg/dL), and low to moderate ketone levels (0.5-3mM). While insulin is low to moderate, it is still sufficient to regulate body fat and ketone metabolism in the homeostatic levels. Unsurprisingly, there is no reported literature that a very-low carbohydrate diet increases the risk of ketoacidosis in Type-1 Diabetics.
It is also worth noting that a VLCKD is currently being used as a therapeutic tool outside of Type-1 Diabetes for other numerous health, disease, and performance applications (Feinman et al., 2015; Paoli, Rubini, Volek, & Grimaldi, 2013; Phinney, Bistrian, Evans, Gervino, & Blackburn, 1983; Phinney et al., 1980; Poff et al., 2017; Stafstrom & Rho, 2012; Volek et al., 2016). Excitingly, it has also been shown that ketone bodies have direct signaling effects that reduce oxidative stress and inflammation, while regulating gene expression and metabolism (Koutnik, D'Agostino, & Egan, 2019; Newman & Verdin, 2014). This data indicates that a VLCKD and ketone bodies may have several health-promoting effects which is in opposition to the effects seen in ketoacidosis.
Taken together, a VLCKD does not increase the risk of ketoacidosis. Conversely, ketoacidotic events are near absent (1% reported) in Type-1 Diabetics implementing a VLCKD (Lennerz et al., 2018). This should be unsurprising as risk for ketoacidosis is linked to elevated HbA1c (Butalia, Johnson, Ghali, & Rabi, 2013; Butalia, Patel, Johnson, Ghali, & Rabi, 2014; Cengiz et al., 2013; Lebenthal, Shalitin, Yackobovitch-Gavan, Phillip, & Lazar, 2012; Weinstock et al., 2013) and HbA1c is reduced in Type-1 Diabetics implementing a VLCKD (Lennerz et al., 2018).
7. Protein Intake and Kidney Function?:
Argument: Elevated protein intake may damage the kidney’s since they will be responsible for filtering the biproduct of protein breakdown, urea (Brenner, Meyer, & Hostetter, 1982). Additionally, older studies speculated that elevated protein intake could further harm individuals with chronic kidney disease (Addis, 1948).
Counter-Argument: Fear surrounding protein intake and kidney function was sparked by a hypothesis paper in New England Journal of Medicine speculating that dietary protein intake may be linked to the progressive nature of disease as we age (Brenner et al., 1982). However, evidence for protein-induced kidney “stress” or damage is lacking (Devries et al., 2018). Recent meta-analysis evaluated whether individuals who consume higher protein (≥1.5g protein/kg bodyweight ≥20%energy intake from protein or ≥100g protein/d) versus normal/low protein, had elevated markers of kidney dysfunction via glomerular filtration rate. Devries et al. found that healthy individuals with higher protein intake did not have any difference in progression/changes glomerular filtration rate overtime. In individuals with chronic kidney disease, a low protein diet was shown to delay mortality (Fouque & Laville, 2009). However, a recent analysis indicated that low protein intake in healthy and diseased populations may have no effect or may even be harmful (KDIGO, 2013). Beyond kidney function, higher protein intake has been shown to promote muscle hypertrophy, preserve muscle mass and promote fat loss during periods of caloric restriction, increase satiety, and promote thermogenesis (Devries et al., 2018). Taken together, a high protein intake appears to have several benefits for body composition, does not appear to promote kidney dysfunction, while data in individuals with chronic kidney disease is inconclusive.
8. Pediatrics Paper Limitations:
While the Pediatrics paper is the largest analysis of a very-low carbohydrate diet in Type-1 Diabetics, it did have limitations that were acknowledged by the authors (Lennerz et al., 2018).
Type-1 Grit is a motivated group of individuals who are committed to achieving and managing glycemic control using this nutritional approach. Thus,
Generalization of their results to the broader Type-1 Diabetes community are unknown.
The population studied may represent a unique population of extremely motivated Type-1 Diabetics.
Both limitations may make some wonder how translatable these results are to the greater Type-1 Diabetes community.
Summary: Arguments For & Against Very Low-Carbohydrate Diet?

Table 11 Medical Community Concerns Versus Hopes of Very Low-Carbohydrate Diet in Type-1 Diabetics. Both the concerns and hopes of a VLCKD are depicted.
When considering whether to implement a very low-carbohydrate diet, both the patient and doctor should consider both the concerns and hopes that this dietary strategy may provide (Table 11 and Figure 22). Many healthcare professionals have concerns regarding this approach. However, of the commonly expressed concerns, only LDL Cholesterol and Adherence have supportive data. Alternatively, many benefits have been reported for Type-1 Diabetics implementing a VLCKD including reduced triglycerides, HbA1c, and insulin load, with reported increases in glycemic stability and quality of life. All evidence based concerns and benefits should be considered when determining whether a VLCKD may or may not be an ideal management strategy.

Figure 22 Concerns Versus Benefits For Type-1 Diabetics Using a Very-Low Carbohydrate Diet. Both the perceived concerns of the VLCKD and known benefits are portrayed in the above image. Transparency and Question Marks (?) are used to illustrate where data is currently unavailable to support either the concern and/or benefit claims. At the present moment, based on the data, benefits of the VLCKD appear to outweigh the concerns.
Can all Type-1 Diabetics utilize this approach to achieve glycemic control? This is something we need to ask ourselves. My personal experience, and the emergent data I have discussed here represent HOPE. Hope that Type-1 Diabetics can, in fact, achieve glycemic control RIGHT NOW by understanding nutrition’s role in glycemic control and implementing a glycemic management plan which reflects that understanding. I am hopeful that more research will emerge on this topic that will help inform and guide patients’ decisions and physicians’ protocols. More research will help us all understand the robustness of these approaches, but also the limitations. While the ultimate goal in Type-1 Diabetes is a cure, the reality is that more research will be required to understand the autoimmunity of this disease in order to overcome it. This may be decades away... In the meantime, it appears that a real option is on the table to help Type-1 Diabetics normalize glycemic control, it just might take a little GRIT.
Resources:
Dr. Bernstein’s Diabetic Solutions: A Complete Guide to Achieving Normal Blood Sugars is an all-encompassing guide for implementing a very-low carbohydrate diet in Type-1 and Type-2 Diabetics to normalize glycemic control. Dr. Bernstein is a Type-1 Diabetic and Endocrinologist himself. This is one of the most comprehensive books on diabetes management that I have read. Dr. Bernstein and Dr. RD Dikeman have a Youtube Channel (Diabetes University) were they put out consistent videos on various diabetes management topics.


Type-1 Grit Facebook Community is one of the best resources a Type-1 Diabetic can have if they are implementing a very-low carbohydrate diet. This community gives Type-1 Diabetic and Type-1 Diabetic caregivers a place to converse on various topics, ask for advice, and communicate with others on their Type-1 Diabetic journeys. I have had Type-1 Diabetes for 12 years and still find this group to be very educating. Having 3000 individuals who have some type of experience, direct or indirect, on Type-1 Diabetes management is a priceless resource and hard to replicate in any clinic or book. https://www.facebook.com/Type1Grit/ (public facebook group)

The Ketogenic Diet for Type-1 Diabetes by Ellen Davis and Dr. Keith Runyan is another book focused on dietary therapy for Type-1 Diabetes management. This book focused more specifically on the ketogenic diet for Type-1 Management. Dr. Keith Runyan is a Type-1 Diabetic and physician and also puts out a blog https://ketogenicdiabeticathlete.wordpress.com/author/krunyanmd/

Caroline’s Keto Kitchen is a recipe blog for various low carbohydrate food options (http://www.carolinesketokitchen.com). Caroline is a Type-1 Diabetic herself and helps put out recipes that other Type-1 Diabetic can use to prevent high blood glucose spikes. I have tried a lot of her recipes and I feel comfortable saying that she puts out incredible material. Her blog is exceptionally helpful for those trying to recreate the “sweet treats” they miss on a high carbohydrate diet
The Art and Science of Low Carbohydrate Living & The Art and Science of Low Carbohydrate Performance by Dr. Jeff Volek and Dr. Stephen Phinney are incredible introduction books on how to implement the very-low carbohydrate diet for general health or performance. Neither book is meant for diabetic populations, but they do provide a great resource for those looking to gather better understanding on these dietary approaches from researcher who have studied this diet for more than 20years.

Story at a Glance:
Type-1 diabetics are not taught enough about nutrition to optimize glycemic control
Currently, most Type-1 diabetics are recommended to follow a high carbohydrate, moderate protein, low fat diet (aka Standard Dietary Approach), yet there has been no clinical trial to validate that this dietary protocol is optimal for Type-1 Diabetic glycemic management.
Why? This is the standard recommendation given to non-diabetics, doctors don’t want children to feel different from their peers by eating a separate diet, and finally compliance – new dietary strategies take effort and patients/care-givers may find them difficult to implement
When something is “essential” it indicates that the body does not produce it on its own and requirements must be met through dietary practices; there are no essential carbohydrates, there are however, essential fatty acids (from fats) and essential amino acids (from protein)
Each macronutrient effects blood glucose differently and therefore all three have different insulin requirements
Carbohydrates (minus fiber) are converted into individual glucose molecules which enter the blood stream and raise blood glucose (more carbohydrates = more blood glucose).
Protein breaks down into individual amino acids; a portion of these can undergo gluconeogenesis and increase blood glucose levels. The effect on blood glucose is much smaller, delayed, and indirect compared to carbohydrates.
Fats have very little effect on blood glucose levels; only the glycerol backbone of triglycerides (3 fatty acids + 1 glycerol) can be converted to glucose, whereas fatty acids cannot.
Exogenous insulin is required to attenuate blood glucose elevations for both carbohydrates, protein, and the residual production of glucose even during fasting periods (e.g. sleeping or long periods between meals)
The Basal-Bolus Protocol is the most commonly used insulin regimen for Type-1 Diabetics and uses basal insulin (long-acting insulin) to provide a steady low level of insulin for residual glucose production, and bolus insulin (rapid-acting insulin) upon food ingestion (amount of insulin is determined using the carbohydrate counting method from part 2)
The Basal-Bolus Protocol on Standard Dietary Approach has not been shown to normalize blood glucose, likely due to the variety of other lifestyle factors that influence glycemic control
Metabolism is incredibly complicated – The Hypothetic Equation for estimating the net change in blood glucose when ingesting a meal and taking exogenous insulin does not reliably result in controlled or predictable blood glucose levels validating how difficult it is for a Type-1 Diabetic to control blood glucose
For a Type-1 Diabetic, each meal presents itself as a mathematical guessing game with insulin; predicting insulin requirements to prevent elevations in blood glucose is often uncontrollable and unpredictable and is certainly not as simple as matching grams of carbohydrates to IUs of insulin
The larger the insulin requirements the more blood glucose mistakes (blood glucose fluctuations and inconsistencies)
Andrew’s personal experience (along with 1000’s of other anecdotal reports via Type-1 Grit) with a very low-carbohydrate approach has proven him success in reliably keeping his average blood glucose within the normal healthy non-diabetic range
Andrew’s current dietary regimen:
3 meals/day
Very low-carbohydrate (~<50g/day;<10% total daily calories)
High protein (~200-300g)
Variable fat (~200g/day)
Andrew’s current insulin regimen:
Basal-Bolus Protocol
Administers ~20-30IU/daily (~70% reduction from what he required eating the Standard Dietary Approach)
Andrew’s average blood glucose throughout the day is in a range that is considered normal for non-diabetics (normoglycemia), with minor fluctuations
Andrew’s average HbA1c is 4.9% falling into the 0.1% of Type-1 diabetics (based on data from T1D Exchange), and in a range considered normal and healthy
Absent carbohydrates, Andrew has been able to lower insulin requirements, reduce blood glucose fluctuations, and better match exogenous Regular-Acting insulin kinetics to that of blood glucose responses from protein plus fat
Type-1 Grit is a community of Type-1 Diabetics utilizing this very low carbohydrate approach and is based on the principles outlined in Dr. Richard Bernstein’s Diabetic Solution Book (A book that Andrew highly recommends)
Results from a 2018 study on 300 participants from the Type-1 Grit community who had been consuming a very low-carbohydrate diet for at least 3 months showed an average blood glucose of 104mg/dL representing an HbA1c that only 1.28% of Type-1 Diabetics achieve (based on data from T1D Exchange)
A very low-carbohydrate diet is criticised for reasons such as:
High dietary fat intake: high fat diets are typically associated with the “Western diet” (high fat AND high carbohydrate) which is generally frowned upon due to its obesogenic properties, however this is not the same as a very low-carbohydrate diet where carbohydrates are restricted
LDL cholesterol: very low-carbohydrate diets may elevate LDL cholesterol which concern some endocrinologists, however it is recently being debated whether LDL cholesterol is a sole causal player in cardiovascular disease
Compliance: Some argue that a strict dietary regimen such as a very low-carbohydrate diet is difficult to follow for many reasons, however with the growth of this movement, many resources are available to makes this dietary approach very enjoyable and sustainable
Children’s growth: There is concern that very low-carbohydrate diets may stunt growth in children based off reports in epileptic children, however the approach for Type-1 Diabetes does not require the level of protein restriction necessary to alleviate seizures and allows enough protein for optimal growth (not to mention poor glycemic control has been linked to blunted growth in children)
Long-term health: There is no epidemiological data looking at long-term outcomes of individuals on a very-low carbohydrate diet, however there are many long-term adverse effects of poor glycemic control and there is data in animal models that show beneficial effects of a very low-carbohydrate diet
Pediatrics Paper Limitations: Type-1 Grit is a motivated group of individuals and may represent outliers of the Type-1 Diabetic community as a whole, however this data represents hope to those desperate for management of their disease (Andrew argues, it just might take a little GRIT)
References:
Addis, T. (1948). Glomerular nephritis: diagnosis and treatment. New York: Macmillan.
Alemzadeh, R., Berhe, T., & Wyatt, D. T. (2005). Flexible insulin therapy with glargine insulin improved glycemic control and reduced severe hypoglycemia among preschool-aged children with type 1 diabetes mellitus. Pediatrics, 115(5), 1320-1324. doi:10.1542/peds.2004-1439
American Diabetes, A. eAG/A1C Conversion Calculator. Retrieved from https://professional.diabetes.org/diapro/glucose_calc
American Diabetes, A. (2016). Diagnosing Diabetes and Learning About Prediabetes. Retrieved from http://www.diabetes.org/diabetes-basics/diagnosis/
American Diabetes, A. (2017). Grains and Starchy Vegetables. Retrieved from http://www.diabetes.org/food-and-fitness/food/what-can-i-eat/making-healthy-food-choices/grains-and-starchy-vegetables.html?loc=cyp
American Diabetes, A. (2018a). 8. Pharmacologic Approaches to Glycemic Treatment: Standards of Medical Care in Diabetes-2018. Diabetes Care, 41(Suppl 1), S73-S85. doi:10.2337/dc18-S008
American Diabetes, A. (2018b). Create Your Plate. Retrieved from http://www.diabetes.org/food-and-fitness/food/planning-meals/create-your-plate/
American Diabetes, A. (2018c). Fruits. Retrieved from http://www.diabetes.org/food-and-fitness/food/what-can-i-eat/making-healthy-food-choices/fruits.html?loc=cyp
Austin, M. A., Breslow, J. L., Hennekens, C. H., Buring, J. E., Willett, W. C., & Krauss, R. M. (1988). Low-density lipoprotein subclass patterns and risk of myocardial infarction. JAMA, 260(13), 1917-1921.
Berg JM, T. J., Stryer L. (2002). Biochemistry (5th ed.). New York: W H Freeman.
Bernstein, R. K. (2011). Dr. Bernstein's Diabetes Solution: The Complete Guide to Achieving Normal Blood Sugars (4th Ed.): Little, Brown Spark.
Bhanpuri, N. H., Hallberg, S. J., Williams, P. T., McKenzie, A. L., Ballard, K. D., Campbell, W. W., . . . Volek, J. S. (2018). Cardiovascular disease risk factor responses to a type 2 diabetes care model including nutritional ketosis induced by sustained carbohydrate restriction at 1 year: an open label, non-randomized, controlled study. Cardiovasc Diabetol, 17(1), 56. doi:10.1186/s12933-018-0698-8
Bonfig, W., Kapellen, T., Dost, A., Fritsch, M., Rohrer, T., Wolf, J., . . . the German Bundesministerium fur Bildung und Forschung Competence Net for Diabetes, M. (2012). Growth in children and adolescents with type 1 diabetes. J Pediatr, 160(6), 900-903 e902. doi:10.1016/j.jpeds.2011.12.007
Butalia, S., Johnson, J. A., Ghali, W. A., & Rabi, D. M. (2013). Clinical and socio-demographic factors associated with diabetic ketoacidosis hospitalization in adults with Type 1 diabetes. Diabet Med, 30(5), 567-573. doi:10.1111/dme.12127
Butalia, S., Patel, A. B., Johnson, J. A., Ghali, W. A., & Rabi, D. M. (2014). Association between diabetic ketoacidosis hospitalizations and driving distance to outpatient diabetes centres in adults with type 1 diabetes mellitus. Can J Diabetes, 38(6), 451-455. doi:10.1016/j.jcjd.2013.12.009
Cengiz, E., Xing, D., Wong, J. C., Wolfsdorf, J. I., Haymond, M. W., Rewers, A., . . . Network, T. D. E. C. (2013). Severe hypoglycemia and diabetic ketoacidosis among youth with type 1 diabetes in the T1D Exchange clinic registry. Pediatr Diabetes, 14(6), 447-454. doi:10.1111/pedi.12030
Chamberlain, J. J., Kalyani, R. R., Leal, S., Rhinehart, A. S., Shubrook, J. H., Skolnik, N., & Herman, W. H. (2017). Treatment of Type 1 Diabetes: Synopsis of the 2017 American Diabetes Association Standards of Medical Care in Diabetes. Ann Intern Med, 167(7), 493-498. doi:10.7326/M17-1259
Cherubini, V., Iannilli, A., Iafusco, D., Cardella, F., Giamprini, M. S., Fanelli, C., & Coppa, G. V. (2006). Premeal insulin treatment during basal-bolus regimen in young children with type 1 diabetes. Diabetes Care, 29(10), 2311-2312. doi:10.2337/dc06-0754
Collier, G., & O'Dea, K. (1983). The effect of coingestion of fat on the glucose, insulin, and gastric inhibitory polypeptide responses to carbohydrate and protein. Am J Clin Nutr, 37(6), 941-944. doi:10.1093/ajcn/37.6.941
Constance A, H. C., Hayes C, Pereira R, Ross T, Swift C. (2011). My Carbohydrate Guide. In. Retrieved from http://www.lillydiabetes.com/_assets/pdf/ld90766_carbguide.pdf
Conway, B. N., Lopes-Virella, M. F., & Blot, W. J. (2018). Late adulthood mortality among African-American and white American people with Type 1 diabetes according to age at diabetes diagnosis. Diabet Med, 35(6), 729-736. doi:10.1111/dme.13617
Dansinger, M. L., Gleason, J. A., Griffith, J. L., Selker, H. P., & Schaefer, E. J. (2005). Comparison of the Atkins, Ornish, Weight Watchers, and Zone diets for weight loss and heart disease risk reduction: a randomized trial. JAMA, 293(1), 43-53. doi:10.1001/jama.293.1.43
Dashti, H. M., Mathew, T. C., Hussein, T., Asfar, S. K., Behbahani, A., Khoursheed, M. A., . . . Al-Zaid, N. S. (2004). Long-term effects of a ketogenic diet in obese patients. Exp Clin Cardiol, 9(3), 200-205.
Devries, M. C., Sithamparapillai, A., Brimble, K. S., Banfield, L., Morton, R. W., & Phillips, S. M. (2018). Changes in Kidney Function Do Not Differ between Healthy Adults Consuming Higher- Compared with Lower- or Normal-Protein Diets: A Systematic Review and Meta-Analysis. J Nutr, 148(11), 1760-1775. doi:10.1093/jn/nxy197
Diabetes, C., Complications Trial/Epidemiology of Diabetes, I., & Complications Research, G. (2016). Risk Factors for Cardiovascular Disease in Type 1 Diabetes. Diabetes, 65(5), 1370-1379. doi:10.2337/db15-1517
Douris, N., Melman, T., Pecherer, J. M., Pissios, P., Flier, J. S., Cantley, L. C., . . . Maratos-Flier, E. (2015). Adaptive changes in amino acid metabolism permit normal longevity in mice consuming a low-carbohydrate ketogenic diet. Biochim Biophys Acta, 1852(10 Pt A), 2056-2065. doi:10.1016/j.bbadis.2015.07.009
DuBroff, R. (2017). Cholesterol paradox: a correlate does not a surrogate make. Evid Based Med, 22(1), 15-19. doi:10.1136/ebmed-2016-110602
Eiswirth, M., Clark, E., & Diamond, M. (2018). Low carbohydrate diet and improved glycaemic control in a patient with type one diabetes. Endocrinol Diabetes Metab Case Rep, 2018. doi:10.1530/EDM-18-0002
Envigo. Diet induced obesity. Retrieved from https://www.envigo.com/products-services/teklad/laboratory-animal-diets/custom-research/diet-induced-obesity/
Exchange, T. D. T1D Discovery Tool. Retrieved from https://t1dexchange.org/pages/resources/our-data/
Feinman, R. D., Pogozelski, W. K., Astrup, A., Bernstein, R. K., Fine, E. J., Westman, E. C., . . . Worm, N. (2015). Dietary carbohydrate restriction as the first approach in diabetes management: critical review and evidence base. Nutrition, 31(1), 1-13. doi:10.1016/j.nut.2014.06.011
Ference, B. A., Ginsberg, H. N., Graham, I., Ray, K. K., Packard, C. J., Bruckert, E., . . . Catapano, A. L. (2017). Low-density lipoproteins cause atherosclerotic cardiovascular disease. 1. Evidence from genetic, epidemiologic, and clinical studies. A consensus statement from the European Atherosclerosis Society Consensus Panel. Eur Heart J, 38(32), 2459-2472. doi:10.1093/eurheartj/ehx144
Fouque, D., & Laville, M. (2009). Low protein diets for chronic kidney disease in non diabetic adults. Cochrane Database Syst Rev(3), CD001892. doi:10.1002/14651858.CD001892.pub3
Franz, M. J., Boucher, J. L., & Evert, A. B. (2014). Evidence-based diabetes nutrition therapy recommendations are effective: the key is individualization. Diabetes Metab Syndr Obes, 7, 65-72. doi:10.2147/DMSO.S45140
Franz, M. J., Powers, M. A., Leontos, C., Holzmeister, L. A., Kulkarni, K., Monk, A., . . . Gradwell, E. (2010). The evidence for medical nutrition therapy for type 1 and type 2 diabetes in adults. J Am Diet Assoc, 110(12), 1852-1889. doi:10.1016/j.jada.2010.09.014
Freeman, J. S. (2009). Insulin analog therapy: improving the match with physiologic insulin secretion. J Am Osteopath Assoc, 109(1), 26-36.
Frohlich-Reiterer, E. E., Kaspers, S., Hofer, S., Schober, E., Kordonouri, O., Pozza, S. B., . . . Diabetes Patienten Verlaufsdokumentationssystem-Wiss Study, G. (2011). Anthropometry, metabolic control, and follow-up in children and adolescents with type 1 diabetes mellitus and biopsy-proven celiac disease. J Pediatr, 158(4), 589-593 e582. doi:10.1016/j.jpeds.2010.09.050
Gardner, C. D., Trepanowski, J. F., Del Gobbo, L. C., Hauser, M. E., Rigdon, J., Ioannidis, J. P. A., . . . King, A. C. (2018). Effect of Low-Fat vs Low-Carbohydrate Diet on 12-Month Weight Loss in Overweight Adults and the Association With Genotype Pattern or Insulin Secretion: The DIETFITS Randomized Clinical Trial. JAMA, 319(7), 667-679. doi:10.1001/jama.2018.0245
Hallberg, S. J., McKenzie, A. L., Williams, P. T., Bhanpuri, N. H., Peters, A. L., Campbell, W. W., . . . Volek, J. S. (2018). Effectiveness and Safety of a Novel Care Model for the Management of Type 2 Diabetes at 1 Year: An Open-Label, Non-Randomized, Controlled Study. Diabetes Ther, 9(2), 583-612. doi:10.1007/s13300-018-0373-9
Hannon, T. S., & Rogol, A. D. (2012). Diabetes mellitus and growth in children and adolescents. J Pediatr, 160(6), 893-894. doi:10.1016/j.jpeds.2012.01.037
Health, H. T. H. C. S. o. P. (2011). Healthy Eating Plate & Healthy Eating Pyramid. Retrieved from https://www.hsph.harvard.edu/nutritionsource/healthy-eating-plate/
Health, H. T. H. C. S. o. P. (2018a). Vegetables and Fruits. Retrieved from https://www.hsph.harvard.edu/nutritionsource/what-should-you-eat/vegetables-and-fruits/
Health, H. T. H. C. S. o. P. (2018b). Whole Grains. Retrieved from https://www.hsph.harvard.edu/nutritionsource/what-should-you-eat/whole-grains/
Heller, S., Buse, J., Fisher, M., Garg, S., Marre, M., Merker, L., . . . Investigators, B. B.-B. T. T. (2012). Insulin degludec, an ultra-longacting basal insulin, versus insulin glargine in basal-bolus treatment with mealtime insulin aspart in type 1 diabetes (BEGIN Basal-Bolus Type 1): a phase 3, randomised, open-label, treat-to-target non-inferiority trial. Lancet, 379(9825), 1489-1497. doi:10.1016/S0140-6736(12)60204-9
Hu, T., & Bazzano, L. A. (2014). The low-carbohydrate diet and cardiovascular risk factors: evidence from epidemiologic studies. Nutr Metab Cardiovasc Dis, 24(4), 337-343. doi:10.1016/j.numecd.2013.12.008
KDIGO. (2013). Kidney Disease: Improving Global Outcomes (KDIGO) CKD Work Group KDIGO 2012 clinical practice guideline for the evaluation and management of chronic kidney disease. Kidney Int Suppl, 3, 1-150.
Khadilkar, V. V., Parthasarathy, L. S., Mallade, B. B., Khadilkar, A. V., Chiplonkar, S. A., & Borade, A. B. (2013). Growth status of children and adolescents with type 1 diabetes mellitus. Indian J Endocrinol Metab, 17(6), 1057-1060. doi:10.4103/2230-8210.122623
Koutnik, A. P., D'Agostino, D. P., & Egan, B. (2019). Anticatabolic Effects of Ketone Bodies in Skeletal Muscle. Trends Endocrinol Metab. doi:10.1016/j.tem.2019.01.006
Kuenen, J. C., Borg, R., Kuik, D. J., Zheng, H., Schoenfeld, D., Diamant, M., . . . Group, A. S. (2011). Does glucose variability influence the relationship between mean plasma glucose and HbA1c levels in type 1 and type 2 diabetic patients? Diabetes Care, 34(8), 1843-1847. doi:10.2337/dc10-2217
Leow, Z. Z. X., Guelfi, K. J., Davis, E. A., Jones, T. W., & Fournier, P. A. (2018). The glycaemic benefits of a very-low-carbohydrate ketogenic diet in adults with Type 1 diabetes mellitus may be opposed by increased hypoglycaemia risk and dyslipidaemia. Diabet Med. doi:10.1111/dme.13663
Lennerz, B. S., Barton, A., Bernstein, R. K., Dikeman, R. D., Diulus, C., Hallberg, S., . . . Ludwig, D. S. (2018). Management of Type 1 Diabetes With a Very Low-Carbohydrate Diet. Pediatrics, 141(6). doi:10.1542/peds.2017-3349
Lebenthal, Y., Shalitin, S., Yackobovitch-Gavan, M., Phillip, M., & Lazar, L. (2012). Retrospective comparative analysis of metabolic control and early complications in familial and sporadic type 1 diabetes patients. J Diabetes Complications, 26(3), 219-224. doi:10.1016/j.jdiacomp.2012.03.016
Livingstone, S. J., Levin, D., Looker, H. C., Lindsay, R. S., Wild, S. H., Joss, N., . . . Scottish Renal, R. (2015). Estimated life expectancy in a Scottish cohort with type 1 diabetes, 2008-2010. JAMA, 313(1), 37-44. doi:10.1001/jama.2014.16425
Livingstone, S. J., Looker, H. C., Hothersall, E. J., Wild, S. H., Lindsay, R. S., Chalmers, J., . . . Colhoun, H. M. (2012). Risk of cardiovascular disease and total mortality in adults with type 1 diabetes: Scottish registry linkage study. PLoS Med, 9(10), e1001321. doi:10.1371/journal.pmed.1001321
Merriam-Webster. (2018). Definition of Macronutrient. Retrieved from https://www.merriam-webster.com/dictionary/macronutrient
Mooradian, A. D., Bernbaum, M., & Albert, S. G. (2006). Narrative review: a rational approach to starting insulin therapy. Ann Intern Med, 145(2), 125-134.
Newburgh, L. H. M., P. L. (1920). THE USE OF A HIGH FAT DIET IN THE TREATMENT OF DIABETES MELLITUS. JAMA Internal Medicine, 26(6), 647-662. doi:10.1001/archinte.1920.00100060002001
Newman, J. C., & Verdin, E. (2014). Ketone bodies as signaling metabolites. Trends Endocrinol Metab, 25(1), 42-52. doi:10.1016/j.tem.2013.09.002
Newman, J. C., Covarrubias, A. J., Zhao, M., Yu, X., Gut, P., Ng, C. P., . . . Verdin, E. (2017). Ketogenic Diet Reduces Midlife Mortality and Improves Memory in Aging Mice. Cell Metab, 26(3), 547-557 e548. doi:10.1016/j.cmet.2017.08.004
Nordmann, A. J., Nordmann, A., Briel, M., Keller, U., Yancy, W. S., Jr., Brehm, B. J., & Bucher, H. C. (2006). Effects of low-carbohydrate vs low-fat diets on weight loss and cardiovascular risk factors: a meta-analysis of randomized controlled trials. Arch Intern Med, 166(3), 285-293. doi:10.1001/archinte.166.3.285
O'Neill, D. F. W., E. C.; Bernstein, R. K. (2003). The effects of a low-carbohydrate regimen on glycemic control and serum lipids in diabetes mellitus. Metab Syndr Relat Disord, 1(4), 291-298. doi:10.1089/1540419031361345
Oza-Frank, R., Cheng, Y. J., Narayan, K. M., & Gregg, E. W. (2009). Trends in nutrient intake among adults with diabetes in the United States: 1988-2004. J Am Diet Assoc, 109(7), 1173-1178. doi:10.1016/j.jada.2009.04.007
Pal, S., & Ellis, V. (2010). The acute effects of four protein meals on insulin, glucose, appetite and energy intake in lean men. Br J Nutr, 104(8), 1241-1248. doi:10.1017/S0007114510001911
Paoli, A., Rubini, A., Volek, J. S., & Grimaldi, K. A. (2013). Beyond weight loss: a review of the therapeutic uses of very-low-carbohydrate (ketogenic) diets. Eur J Clin Nutr, 67(8), 789-796. doi:10.1038/ejcn.2013.116
Parry HA, K. W., Mumford P, Romero M, Hann C, Mobley B, Zhang Y, Roberts MD, Kavazis AN. (2018). Lifelong Ketogenic Diet Feeding Increases Longevity, But Does Not Alter Oxidative Stress Markers in Rats. Paper presented at the Medicine & Science in Sports & Exercise.
Parthasarathy, L., Khadilkar, V., Chiplonkar, S., & Khadilkar, A. (2016). Longitudinal Growth in Children and Adolescents with Type 1 Diabetes. Indian Pediatr, 53(11), 990-992.
Paterson, M., Bell, K. J., O'Connell, S. M., Smart, C. E., Shafat, A., & King, B. (2015). The Role of Dietary Protein and Fat in Glycaemic Control in Type 1 Diabetes: Implications for Intensive Diabetes Management. Curr Diab Rep, 15(9), 61. doi:10.1007/s11892-015-0630-5
Phinney, S. D., Bistrian, B. R., Evans, W. J., Gervino, E., & Blackburn, G. L. (1983). The human metabolic response to chronic ketosis without caloric restriction: preservation of submaximal exercise capability with reduced carbohydrate oxidation. Metabolism, 32(8), 769-776.
Phinney, S. D., Horton, E. S., Sims, E. A., Hanson, J. S., Danforth, E., Jr., & LaGrange, B. M. (1980). Capacity for moderate exercise in obese subjects after adaptation to a hypocaloric, ketogenic diet. J Clin Invest, 66(5), 1152-1161. doi:10.1172/JCI109945
Pinhas-Hamiel, O., Hamiel, U., Boyko, V., Graph-Barel, C., Reichman, B., & Lerner-Geva, L. (2014). Trajectories of HbA1c levels in children and youth with type 1 diabetes. PLoS One, 9(10), e109109. doi:10.1371/journal.pone.0109109
Poff, A., Koutnik, A. P., Egan, K. M., Sahebjam, S., D'Agostino, D., & Kumar, N. B. (2017). Targeting the Warburg effect for cancer treatment: Ketogenic diets for management of glioma. Semin Cancer Biol. doi:10.1016/j.semcancer.2017.12.011
Ranjan, A., Schmidt, S., Damm-Frydenberg, C., Holst, J. J., Madsbad, S., & Norgaard, K. (2017). Short-term effects of a low carbohydrate diet on glycaemic variables and cardiovascular risk markers in patients with type 1 diabetes: A randomized open-label crossover trial. Diabetes Obes Metab, 19(10), 1479-1484. doi:10.1111/dom.12953
Roberts, M. N., Wallace, M. A., Tomilov, A. A., Zhou, Z., Marcotte, G. R., Tran, D., . . . Lopez-Dominguez, J. A. (2018). A Ketogenic Diet Extends Longevity and Healthspan in Adult Mice. Cell Metab, 27(5), 1156. doi:10.1016/j.cmet.2018.04.005
Saaddine, J. B., Fagot-Campagna, A., Rolka, D., Narayan, K. M., Geiss, L., Eberhardt, M., & Flegal, K. M. (2002). Distribution of HbA(1c) levels for children and young adults in the U.S.: Third National Health and Nutrition Examination Survey. Diabetes Care, 25(8), 1326-1330.
Schrauwen, P., & Westerterp, K. R. (2000). The role of high-fat diets and physical activity in the regulation of body weight. Br J Nutr, 84(4), 417-427.
Soedamah-Muthu, S. S., Fuller, J. H., Mulnier, H. E., Raleigh, V. S., Lawrenson, R. A., & Colhoun, H. M. (2006). High risk of cardiovascular disease in patients with type 1 diabetes in the U.K.: a cohort study using the general practice research database. Diabetes Care, 29(4), 798-804.
Stafstrom, C. E., & Rho, J. M. (2012). The ketogenic diet as a treatment paradigm for diverse neurological disorders. Front Pharmacol, 3, 59. doi:10.3389/fphar.2012.00059
Thompson R, C. D., Hindmarsh PC. (2006). The role for insulin analogs in diabetes care. Current Paediatrics, 16, 117-122.
Turton, J. L., Raab, R., & Rooney, K. B. (2018). Low-carbohydrate diets for type 1 diabetes mellitus: A systematic review. PLoS One, 13(3), e0194987. doi:10.1371/journal.pone.0194987
USDA. (2017). Grains. Retrieved from https://www.choosemyplate.gov/grains
USDA. (2018a). Choose My Plate. Retrieved from https://www.choosemyplate.gov
USDA. (2018b). Fruit. Retrieved from https://www.choosemyplate.gov/fruit
Vernon, M. C., Mavropoulos, J., Transue, M., Yancy, W. S., & Westman, E. C. (2003). Clinical experience of a carbohydrate-restricted diet: effect on diabetes mellitus. Metab Syndr Relat Disord, 1(3), 233-237. doi:10.1089/154041903322716714
Vining, E. P., Pyzik, P., McGrogan, J., Hladky, H., Anand, A., Kriegler, S., & Freeman, J. M. (2002). Growth of children on the ketogenic diet. Dev Med Child Neurol, 44(12), 796-802.
Volek, J. S., Freidenreich, D. J., Saenz, C., Kunces, L. J., Creighton, B. C., Bartley, J. M., . . . Phinney, S. D. (2016). Metabolic characteristics of keto-adapted ultra-endurance runners. Metabolism, 65(3), 100-110. doi:10.1016/j.metabol.2015.10.028.
Weinstock, R. S., Xing, D., Maahs, D. M., Michels, A., Rickels, M. R., Peters, A. L., . . . Network, T. D. E. C. (2013). Severe hypoglycemia and diabetic ketoacidosis in adults with type 1 diabetes: results from the T1D Exchange clinic registry. J Clin Endocrinol Metab, 98(8), 3411-3419. doi:10.1210/jc.2013-1589.
Williams, P. T., Superko, H. R., Haskell, W. L., Alderman, E. L., Blanche, P. J., Holl, L. G., & Krauss, R. M. (2003). Smallest LDL particles are most strongly related to coronary disease progression in men. Arterioscler Thromb Vasc Biol, 23(2), 314-321.
Woodyatt, R. T. (1921). OBJECTS AND METHOD OF DIET ADJUSTMENT IN DIABETES. JAMA Internal Medicine, 28(2), 125-141. doi:10.1001/archinte.1921.00100140002001

